Updates
Certification
I received a Data Analytics and Visualization certification of completion from UC Berkeley Extension in August 2020.
I am a certified Tableau Desktop Specialist since April 2021.
Technical Skills:
Python
Pandas | Matplotlib | Scikit-Learn | Spark | TensorFlow
NumPy | Flask |
APIs | Splinter | Beautiful Soup
Javascript
D3 | Leaflet | Plotly
Databases
SQL | PostgreSQL | AWS Cloud
Other
Tableau | Bootstrap 3 & 4 HTML/CSS | Microsoft Suite (SharePoint, Excel, Word, PowerPoint) | Google Suite(Colaboratory, Sites, Sheets, Docs, Slides, Forms)
Google Analytics
I'm studying to be Google Analytics IQ Certified.
Certificate of Completion, Google Analytics for Beginners
Works - Data
Data Analytics and Visualization Projects
Team Project:
ML Models - Olympics prediction and Visualization
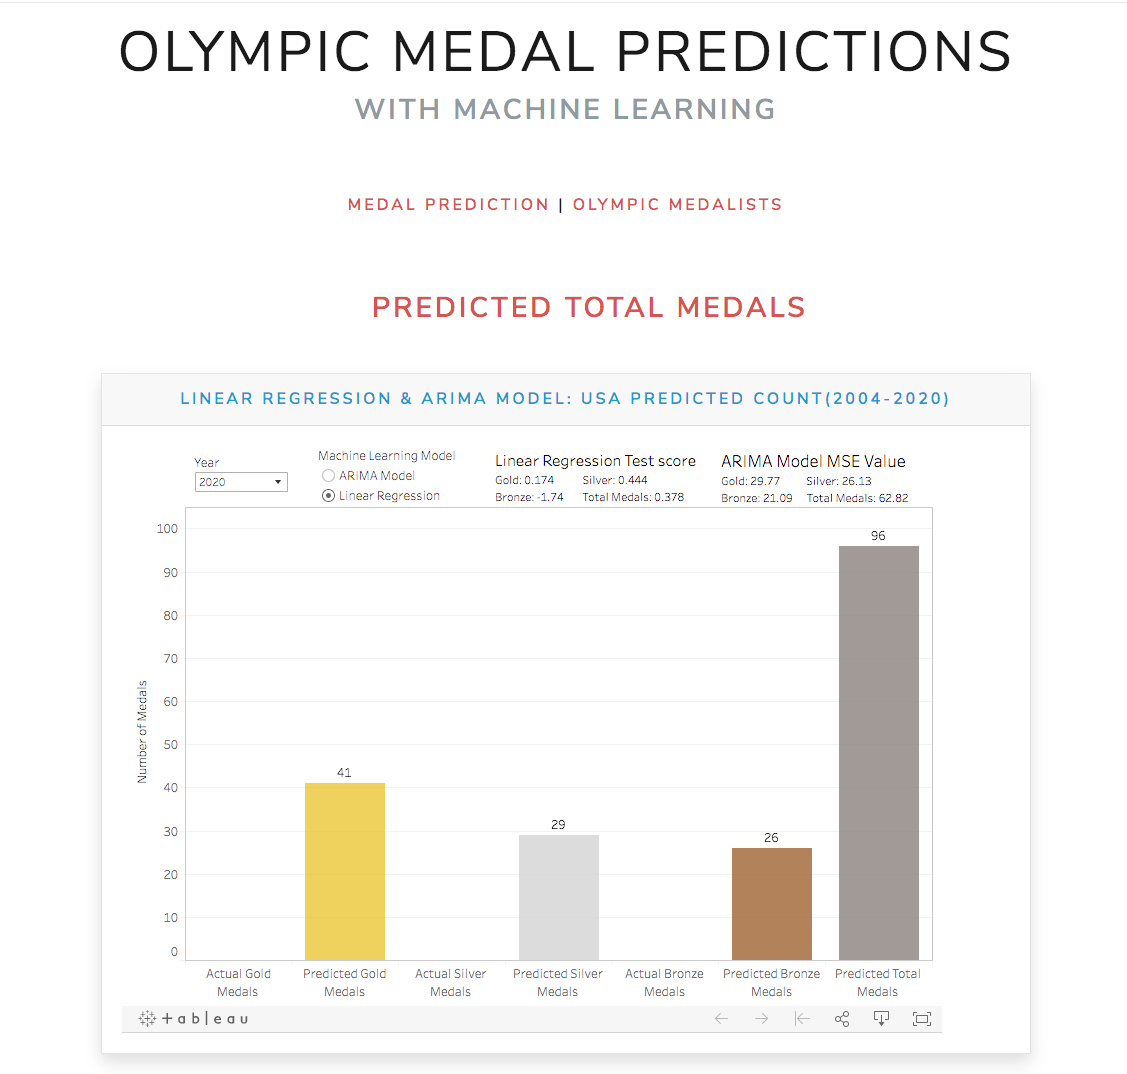
Used Python Pandas, Python Matplotlib, Tableau, and HTML/CSS/Bootstrap 4 to predict 2020 Tokyo Olympic medal counts for Top 25 countries and USA from our previous Olympics Analysis as well as predict the type of medallist who would participate in each Olympic sport.
My role was revamping our webpage to have a collective theme, a project summary home page, and a machine learning prediction page that included a Tableau visualization and Bootstrap 4 made tables; additionally contributing to the Presentation slides.
Big Data:
PySpark and Google Colaboratory

Using PySpark with Google Suite's Colab Notebooks. Executed ETL and analysis on Amazon's Cloud Relational Database on product reviews on Outdoor products made by customers and Vine Program customers.
Tableau Public - NYC Citi Bike

Interactive Tableau Storyboard with bar and area charts, tables, and maps to visualize the NYC CitiBike clientele through pick-up station popularity, ridership growth, user demographics, and bike usage.
Team Project:
ETL(Extract, Transform, Load) - IMDb Movies

Web and API Data Extraction. Transformation with Jupyter Notebook. Loading datasets with PostgreSQL in pgAdmin4. Aimed at looking into Top IMDb movies, IMDb and Netflix ratings, and streaming services available for that movie.
My role was transformation of the web data.
Team Project:
Python library: Matplotlib - Great Barrier Reef

Data Extraction. Transformation with Jupyter Notebook to uncover the effects of global climate change on the Australian Great Barrier Reef. Used matplotlib to plot data.
My role was analysis on the Northern station Reef barrier with bar and line charts.
Works - Design
Web Design Projects
Team Project:
Olympics: Data Visualization and Medal Prediction
Used Python Pandas, Python Matplotlib, Tableau, and HTML/CSS/Bootstrap 4 to predict 2020 Tokyo Olympic medal counts for Top 25 countries and USA from our previous Olympics Analysis as well as predict the type of medallist who would participate in each Olympic sport.
My role was revamping our webpage to have a collective theme, a project summary home page, and a machine learning prediction page that included a Tableau visualization and Bootstrap 4 made tables; additionally contributing to the Presentation slides.
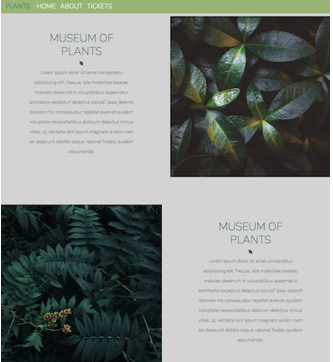
Museum of Plants
Responsive Web Page with Bootstrap 4 HTML/CSS, Javascript Webpage. Using the Grid system and Flexbox Utilities.

Biodiversity Dashboard
Creating an interactive dashboard that allows for displaying dataset for a specific value using Javascript, Bootstrap 4 HTML and CSS, D3.js, and Plotly.js.

Bontanical Garden
Webpage with Bootstrap 4 HTML and CSS. Using Grid system and Flexbox Utilities.
BootCamp Spot Dashboard copy

Responsive Webpage with Bootstrap 4 HTML/CSS using Grid system and Flexbox Utilities to recreate a Bootcamp Spot Grades Web application.
Bucket List